

Overview
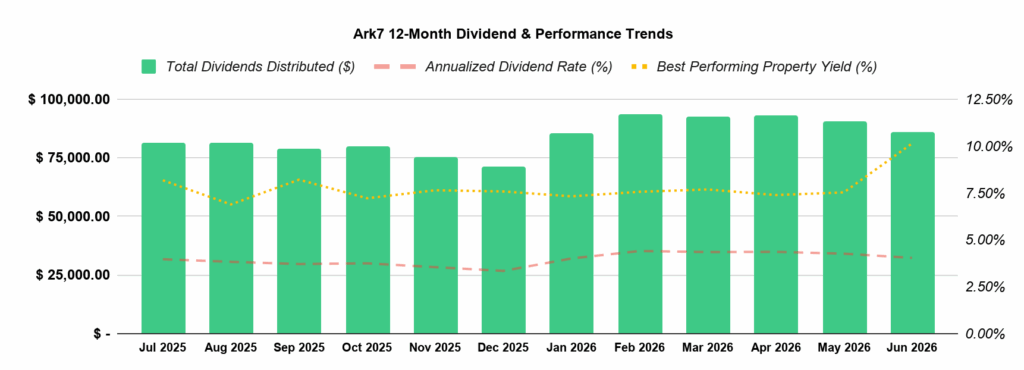
June was a month of steady returns for Ark7’s portfolio, with $86,052.20 in total dividends distributed and a 4.04% annualized dividend return rate. Atlanta-C3, Chicago-C1, and DFW-S19 led in dividend yield, delivering returns of 10.14%, 7.98%, and 7.75%. This shows the cash-yielding strength of our top-performing assets.
The portfolio’s occupancy rate remains steady at 92.50%, reflecting stable rental demand across our properties.
Short-term rental properties continued to contribute steady income, with Atlanta-C3 (10.14%), Atlanta-C8 (5.87%), Seattle-D1 (5.02%) all yielding over 5%.
On the trading side, $470,291 in transactions were processed, with 31 properties (70% of the portfolio) actively trading. Berkeley-M3, Atlanta-C10, and Chandler-S4 topped the charts in trading volume and investor activity, while Urbana-S11 led all properties with a 32.00% price increase, followed by Atlanta-T3 and Atlanta-T5.
With growing rental income performance and trading activity, Ark7 continues to offer reliable returns and steady growth to our investors.
1. Dividend Summary
💰 Total Dividends Distributed: $86,052.20
📈 Portfolio Annualized Dividend Return Rate: 4.04%
🏆 Top Performing Properties by Dividend Yield:
- Atlanta-C3 – 10.14%
- Chicago-C1 – 7.98%
- DFW-S19 – 7.75%
2. Dividend & Performance Trends (Past 12 Months) 📊
3. Portfolio Performance & Rental Updates
Overall Portfolio Snapshot
- Occupancy Rate: 92.50%
- New Leases Signed: 0
- Short-Term Rental Highlights: Atlanta-C3 (10.14%), Atlanta-C8 (5.87%), Seattle-D1 (5.02%)
Key Rental & Lease Updates
🔹 Vacancy & Tenant Turnovers
- No vacancy or turnovers this mont
🔹 Operational Events
- No operational events this month
🔹 Notable Short-Term Rental Performance
The short-term rental segment continues demonstrating strong performance, exceeding a 5%+ rental yield.
| Property | Dividend |
|---|---|
| Atlanta-C3 | 10.14% |
| Atlanta-C8 | 5.87% |
| Seattle-D1 | 5.02% |
4. Featured Investment Opportunities 🚀
New to passive real estate investing?
Explore Ark7 Opportunities5. Trading Market Growth 📊
- Total Transactions This Month: $470,291
- Month-over-Month Growth: 44.64%
- Properties Available for Trading: 31 (70% of portfolio)
Top 3 Properties by Trading Volume:
The following properties saw the highest trading activity this month, reflecting strong investor interest and market liquidity.
| Property | Trading Volume | Price Change | Trading Volume Growth |
|---|---|---|---|
| Berkeley-M3 | $35,234 | -4.52% | -30.56% |
| Atlanta-C10 | $29,549 | -0.50% | -7.23% |
| Chandler-S4 | $23,130 | 10.00% | 42.85% |
Top 3 Properties by Performing (Price Change):
These properties experienced the highest price appreciation, demonstrating strong growth potential and investor confidence.
| Property | Price Change |
|---|---|
| Urbana-S11 | +32.00% |
| Atlanta-T3 | +22.50% |
| Atlanta-T5 | +18.00% |