If you’re investing in real estate, tracking your performance should be always easy and accessible. With Ark7’s newly redesigned Performance Page, you can now view your earnings, analyze your portfolio, and benchmark your progress using streamlined dashboards. Whether you’re a first-time investor or already owning multiple properties, this tool gives you the insights you need to grow your wealth with intention.
Let’s walk through what you can do and how to get the most out of your new dashboards. (Introduction video)
01. Understand your earnings at a glance: How to track rental income and dividends on Ark7
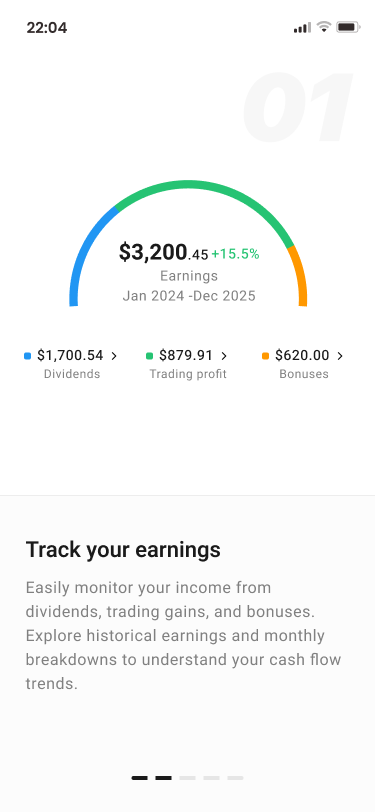
In the My Earnings section, you’ll get a clear breakdown of your income sources. To view data in other time periods, click on the drop down on the upper right corner. You can switch between viewing your all-time earnings or your earnings in a certain year.
To drill down into their respective details page, you can click on:
- Dividends
- Trading profit
- Bonuses
For example: “Clicking on Dividends will open up a page with a line chart to show monthly changes in rental dividends, and a breakdown list of each of your property’s dividend performance. “
02. Fine-tune your strategy with portfolio analysis: Analyze your real estate portfolio by state, rental type and property
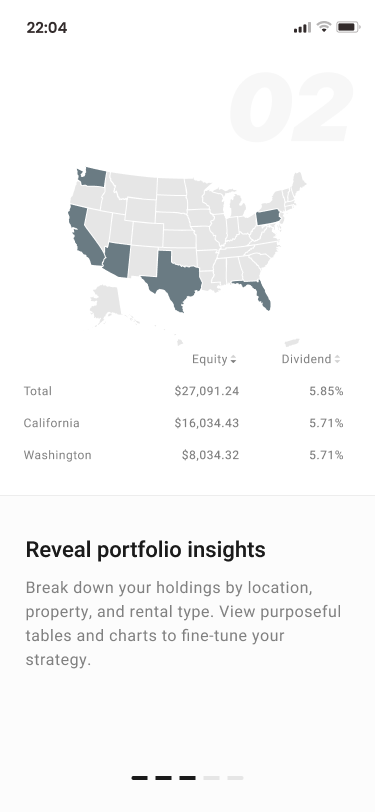
The Portfolio Analysis section gives you the tools to review how your investments are distributed. Click on the tabs to break down your holdings by:
- State
- Property
- Rental type
This helps you identify whether your portfolio is well-balanced or if it’s time to diversify.
For example: “If you notice that 80% of your holdings are concentrated in one state (like Texas), you may want to reduce geographic risk by investing in properties in other states (like Illinois).“
Click on the property names to open up your holding details of that property. You can view your Principle, Average cost, Owned shares, Tradable shares, Certificate, and more.
03. Build better habits with your investment pattern: Stay consistent with monthly investment tracking
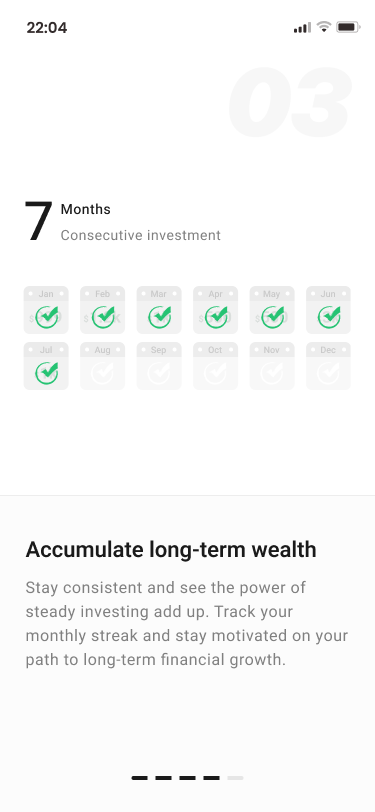
Long-term financial success often comes down to consistency. The My Investment Pattern feature highlights your monthly investing streak, making it easy to stay on track and build momentum. A visual timeline shows you how often you’ve invested, helping you turn investing into a habit.
04. Benchmark against the platform: Compare your returns with Ark7’s overall performance
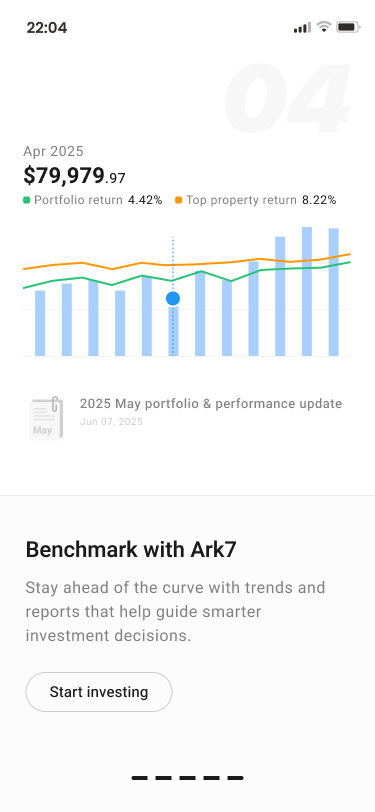
Want to know how your performance stacks up? The Ark7 Performance section lets you compare your returns with platform-wide metrics.
For example: “If you see your average dividend return at 4.1%, while Ark7’s platform average is 5.3% this month. You might dive into the monthly performance reports to see which markets or property types are outperforming and consider reallocating or expanding your holdings there. You can also check the operational updates and occupancy rates. If you hold a unit in a property undergoing renovations (with temporary rent suspension), this section gives you transparency and peace of mind, helping you plan for when those dividends will resume.“
Seeing the broader platform trend gives you important context to evaluate if a dip is personal, property-specific, or market-wide.
04. Unlocking the dashboards: Who can access it?
If you’ve already invested in any property through Ark7, the performance page is automatically unlocked in your account. If you’re a registered user but haven’t made your first investment yet, now’s the time.
You’ll gain access to:
✅ Personalized earnings insights
✅ Real-time portfolio tracking
✅ Tools to plan and grow your wealth over time
Ready to Dive In?
Start enhancing your real estate investment performance with Ark7